After years of challenges in the housing market, finding a desirable home is becoming more attainable.
On a national scale, housing inventory is increasing, providing potential buyers with a wider range of options. However, it is important to note that the rate of growth will differ depending on the region. This underscores the importance of having an agent with local market expertise.
Here is an overview of the current inventory situation to help you understand the trends and set your expectations.
Significant Growth Nationwide
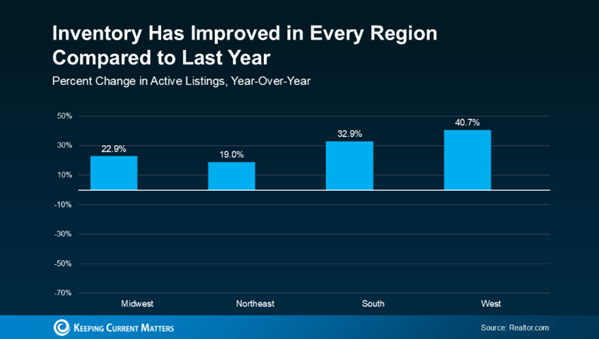
The availability of homes for sale is rising across the country, as illustrated by data from Realtor.com. In each of the four regions, inventory has increased by at least 19% compared to the same period last year. Notably, in the West, there has been an almost 41% year-over-year increase.

There are two primary reasons for this increase:
An increased number of sellers listing their homes. Many homeowners have been waiting for mortgage rates to decrease before making a move. Now, some have decided they can no longer wait. May saw more new listings than any May in the past three years.
Homes are taking longer to sell. This results in listings remaining on the market for a longer period, thereby increasing the total number of available homes. In May, the typical home took 51 days to sell – closer to what is considered typical for the market.
More homes for sale contribute to a more balanced market. For the past few years, sellers have had the upper hand. Now, the dynamics are shifting. Nationally, it is not yet a full-on buyer's market, but it is heading towards a healthier state, especially for homebuyers. Danielle Hale, Chief Economist at Realtor.com, states:
“The number of homes for sale is rising in many markets, giving shoppers more choices than they have had in years . . . the market is starting to rebalance.”
Variability in Growth by Area
However, the time required to achieve true balance will vary by area. Some regions of the country are experiencing inventory that has bounced back to normal levels, while others have not seen as much growth.
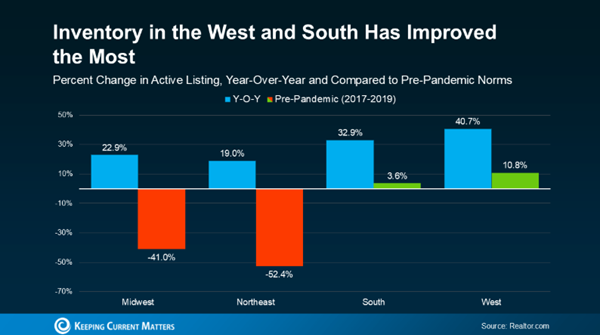
Let us examine another graph. This time, we will compare the current data (what you already saw) to the last normal years in the housing market (2017-2019).
In this comparison, the green indicates which regions have returned to more typical levels of inventory based on recent growth.

You have more housing options now than you did a year ago, which is great. More choices mean finding a home you love should be easier.
However, some markets will take longer to return to typical levels. However, some markets will take longer to return to typical levels. Give me a call to understand the inventory in your desired area. I can provide insights on local growth and help tailor your search.
Bottom Line
Inventory is improving, but recovery time varies by location.


